Personal Loan 데이터 분석
Personal Loan 데이터는 고객을 더 늘리고자 하는 가상의 은행 데이터입니다.
이 회사의 경영진은 부채를 가진 고객을 개인 대출 고객으로 전환하는 방법을 모색하려고 합니다.
데이터 출처 : https://www.kaggle.com/itsmesunil/bank-loan-modelling
Bank_Loan_modelling
Personal Loan classification problem
www.kaggle.com
1. 데이터 확인
# 기본 패키지 불러오기

import math
import numpy as np
import pandas as pd
import matplotlib.pyplot as plt
import seaborn as sns
plt.style.use("seaborn")
sns.set(font_scale = 1)
sns.set_style("whitegrid")

import plotly.express as px

import chart_studio.plotly as py
import cufflinks as cf
cf.go_offline(connected=True)

import plotly.graph_objects as go
import plotly.offline as pyo
pyo.init_notebook_mode()

from plotly.subplots import make_subplots

import missingno as msno

import warnings # 경고 메세지 숨기기
warnings.filterwarnings(action='ignore')

plt.rc("font", family = "AppleGothic") # 한글 폰트 가져오기
plt.rcParams['axes.unicode_minus'] = False # - 기호 깨짐 해결
# 데이터 불러오기

bank = pd.read_excel("data/Personal_Loan.xlsx", sheet_name = 1) # 두번째 시트 불러오기


print(bank.shape)
bank.head()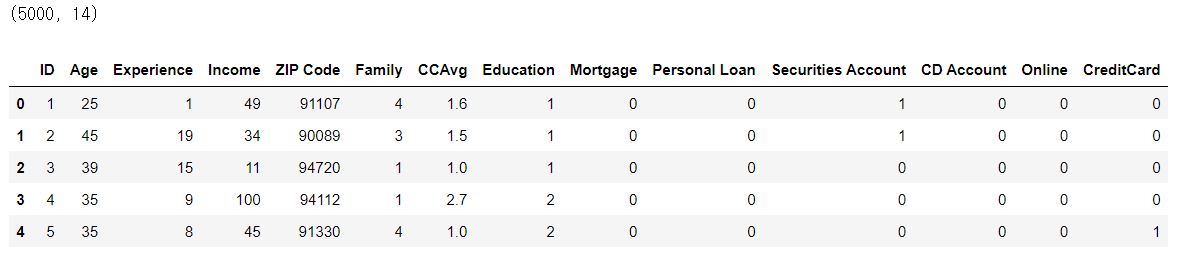
<컬럼 설명>
- ID: 고객 번호
- Age: 나이
- Experience: 사회생활 경험(직장경험)
- Income: 연간 수입(천 단위)
- Zipcode: 우편번호
- Family: 가족 구성원 수
- CCAvg: 신용카드 월평균 이용 금액(천 단위)
- Education: 학력(1: Undergrad, 2: Graduate, 3: Advanced/Professional)
- Mortgage: 주택 담보 대출 금액(천 단위)
- Personal Loan: 지난번 영업에서 고객이 개인대출을 받았는가?(0: N, 1: Y)
- Securities Account: 보험 유무(0: N, 1: Y)
- CD Account:양도성 예금증서 보유 유무(0: N, 1: Y)
- Online: 온라인 뱅킹 유무(0: N, 1: Y)
- Credit Card: 신용카드 보유 유무(0: N, 1: Y)
# 데이터 기본 정보 확인

bank.info()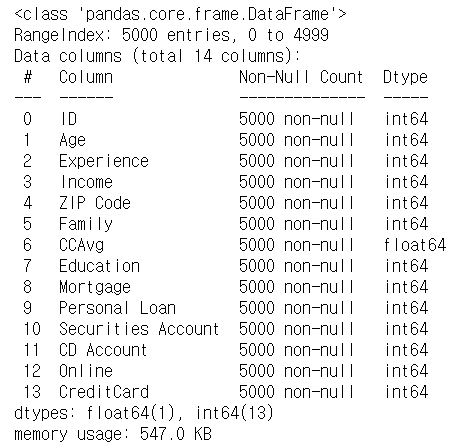
# 변수형 컬럼 내용 확인

print("Education: ", bank["Education"].unique())
print("Personal Loan: ", bank["Personal Loan"].unique())
print("Securities Account: ", bank["Securities Account"].unique())
print("CD Account: ", bank["CD Account"].unique())
print("Online: ", bank["Online"].unique())
print("CreditCard: ", bank["CreditCard"].unique())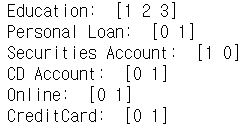
# 연속형(수치) 데이터 통계치 확인

bank.describe().T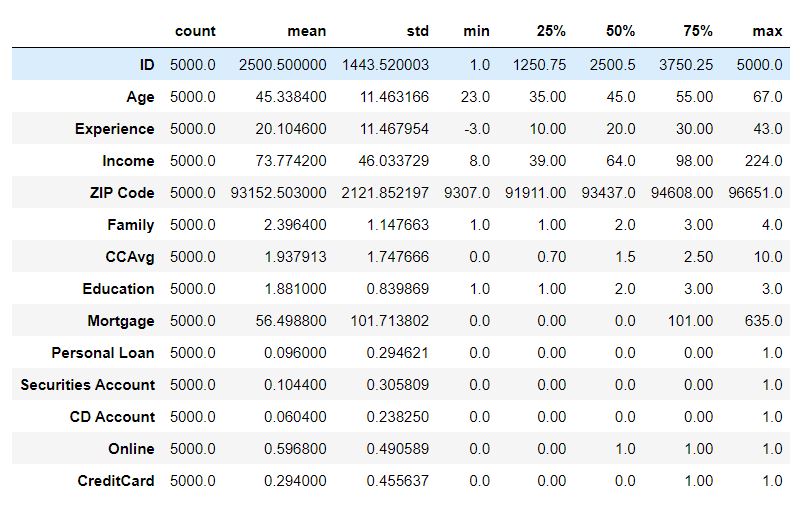
# 결측치 확인

bank.isnull().sum()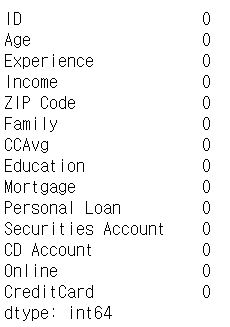
데이터에 결측치가 없는 것을 확인 할 수 있습니다.
# 데이터 내용 정리

print("총 데이터 수: ", bank.shape[0] * bank.shape[1])
print("결측치 수: ", bank.isnull().sum().sum())
print("고객의 나이는 {}세부터 {}세까지 있으며 평균 나이는 {:.1f}세이다.".format((bank['Age'].min()),
                                                         (bank['Age'].max()),
                                                         (bank['Age'].mean())))
print("고객의 평균 수입은 {:.1f} $이며, 최고수입은 {} $로 평균의 {:.1f}배이다.".format((bank['Income'].mean() * 1000),
                                                                 (bank['Income'].max() * 1000),
                                                                 (bank['Income'].max() / (bank['Income'].mean()))))
2. 질문하기
- 수입 / 월평균신용카드사용량 / 가족인원수와 대출 사이의 관계는?
- 변수형 컬럼의 분포 확인
- 각 컬럼간의 상관관계는?
- 월 평균 사용 금액을 구간화 해서 특징을 볼 수 있을까?
'Data Analysis > Kaggle' 카테고리의 다른 글
| [Kaggle] Zomato Bangalore Restaurants 데이터 분석 3 (EDA / 시각화 / 리뷰) (0) | 2021.10.29 |
|---|---|
| [Kaggle] Zomato Bangalore Restaurants 데이터 분석 2 (데이터 전처리) (0) | 2021.10.26 |
| [Kaggle] Zomato Bangalore Restaurants 데이터 분석 1 (데이터 확인 / 질문하기) (0) | 2021.10.26 |
| [Kaggle] Personal Loan 데이터 분석 3 (EDA / 시각화 / 리뷰) (0) | 2021.10.13 |
| [Kaggle] Personal Loan 데이터 분석 2 (데이터 전처리) (0) | 2021.10.13 |


